The Board of Regents would like your feedback on a College and Career Readiness Survey which focuses on three topics: College and Career Readiness Frameworks, Necessary Skills and Knowledge for College and Workforce Success, and New York State Graduation Requirements (current requirements can be found at http://www.p12.nysed.gov/ciai/gradreq/gradreq3columnstyle01_10.pdf).Found this at Kitchen Table Math.

Saturday, February 26, 2011
New York State Regents diploma survey
If you are in New York, the Board of Regents is seeking feedback on college and career readiness issues.
Friday, February 25, 2011
Class size and proficiency level grouping
Here are edited excerpts from a letter I wrote to our local school district last year.
Class Size
I was pleased to hear our superintendent’s recent remarks shedding some light on the mistaken notion that when it comes to class size, smaller is always better. This is consistent with my own observations after reading about class size reduction (CSR) research.
There is no clear-cut evidence that smaller class size significantly improves academic achievement. Even the studies most often cited to defend smaller class sizes only showed minimal and questionable benefits when class sizes were reduced to 15-17 pupils, certainly not a goal seriously contemplated by our school district or by most others in Westchester.
While I empathize with other parents who find small classes intuitively desirable, I agree with the board that budget decisions should be based on the principle of doing the best for our children and not simply on what feels good. I disagree that increasing class size to 27 students is, as I heard one parent say, reverting to “mediocrity” since research consistently shows that it is the other components of an educational program that have the greatest impact on academic excellence.
Proficiency Level Grouping
When our superintendent made the point that budget restrictions could be an opportunity to make creative, valid changes to program design, it occurred to me that if class sizes are going to increase then it would also be a good time to introduce proficiency level grouping.
Like many parents I know, my preference is for my children to be taught in an academic class group where the pace and the instruction are most appropriate for their needs and one that provides the most efficient use of their time in school. While differentiated instruction within one classroom has been vigorously promoted as an innovation capable of addressing the needs of all students in a mixed-proficiency group, I have found it hard to understand how it really works best for my children. Moreover, the individualized attention needed for differentiation would seem to become even more challenging for a teacher as class size increases. In a class of 27 with a one-hour long period, this “individual attention” works out to less than three minutes per child. I cannot see how this is good for either the teacher or the students.
In consideration of the above, our school district should consider instituting proficiency level grouping for core academic subjects at all grade levels, not just in the upper grades as is currently the practice.
This change could benefit all students, but would probably help the academically talented and the struggling learners the most. These quotes from Karen Rogers' Re-Forming Gifted Education recently caught my eye and made me consider how many academically talented students may not be reaching their potential because of their placement in heterogeneous classrooms.
Third and fourth grades seem to be the trouble spots for many gifted children. By the fourth grade, they have experienced several years of coming to school, putting forward very little effort, and getting amply rewarded for it. . . . Many times, these bright children look around and notice that their classmates, who are working more slowly, are not having to do as much work as they do. Therefore, as a first step toward underachievement, they slow down their pace. . . . The second stage of underachievement often follows quickly. If they are frequently told how "good" their work is, even when they know they didn't put out their best effort, these children become less committed to doing their best work.
Conversely, struggling learners in our school district are constantly pulled out of class for the extra help they need. While I understand that the school does its best to coordinate these sessions, pull-outs can create learning disruptions that affect both the individual student and other class members. Ironically, being pulled out sometimes mean the student misses critical classroom instruction and/or interaction that then requires more remedial assistance.
“The Efficient Use of Teachers”, a presentation made at “A Penny Saved: How Schools and Districts Can Tighten Their Belts While Serving Students Better” provides some additional details about class size and proficiency level grouping. on pages 1-12. Many other valid ideas that were presented at this conference can be accessed at the link.
"many young residents" leaving Westchester County - "taxes are way too high,"
...As the Lower Hudson Valley awaits 2010 census results in the next month, it's clear that many young residents have left in search of lower taxes and a lower cost of living.http://www.lohud.com/article/2011102210322
Westchester and Rockland counties, along with New York City, have the state's highest population losses due to movers....
The high number of people moving out, without being replaced, is a key reason the state will lose a representative in Congress while several southern states are expected to gain representatives....
Several Rockland residents said high taxes are a major concern that's making them consider a move."Taxes are way too high," said Peter Chavez of Valley Cottage....
Local officials are concerned about the trend, and hope to keep more residents in the state with job opportunities and judicious spending cuts."Growth requires that we become a less-expensive place to live and work," said Ned McCormack, an adviser to Westchester County Executive Rob Astorino.
For the entire article:
Little Rock in New Rochelle
I don't remember ever learning this until I read about it on a local blog.
Related: Segregation persists in NR?
For the entire article:
"We had Little Rock in New Rochelle and no one was paying attention," said Mark Major, 59, a Lincoln student and lifelong New Rochelle resident.http://www.lohud.com/article/2010101240318
Today [January 24, 2011] marks the 50th anniversary of the federal court decision that forced the desegregation of public schools in New Rochelle. The landmark 1961 case, Taylor v. Board of Education of City School District of City of New Rochelle — named for Hallie and Kevin Taylor, the lead plaintiffs and parents of Lincoln students — was notable because it was the first court victory for those opposing school segregation in a northern city.
Timeline
• 1898: Winyah Avenue Grammar School (eventually renamed Lincoln School) is built.• 1930: Daniel E. Webster Elementary School is built. Whites in the neighboring Lincoln School district are allowed to transfer their children, an option denied blacks.
• 1939: The first black teacher, Ethel O. Harris, is hired at Lincoln after years of campaigning by the National Association for the Advancement of Colored People.
• 1947-48: Some parents suggest building a school to replace a deteriorating Lincoln.
• 1949: After a volatile meeting attended by 500 black parents, the Board of Education agrees to study the issue of redrawing the boundaries of elementary schools.
• 1957: A proposal to rebuild Lincoln on the same site is defeated.
• 1960: A referendum to rebuild Lincoln School is passed. Opposition steps up efforts, picketing Lincoln and unsuccessfully attempting to enroll kids in other schools. In October, Paul Zuber files a lawsuit on behalf of 11 families.
• 1961: On Jan. 24, Judge Irving Kaufman rules that the school board intentionally segregated blacks and orders the district to develop a desegregation plan. The district appeals and loses in August and the U.S. Supreme Court declines to review the case, ending litigation. About 300 students are bused from Lincoln to other schools at the start of the school year.
• 1963: Lincoln closes.
• 1964: Lincoln is demolished.
• 1969: Lincoln Park is built on the old school site.
• 1986: New Rochelle residents celebrate the 25th anniversary of the court decision with a gathering at Lincoln Park.
• 2010-11: New Rochelle schools and local residents commemorate the 50th anniversary of the court ruling.
Source: A 1957 report on New Rochelle by Dan Dodson, an expert on integration, and Journal News research
Related: Segregation persists in NR?
For the district they do not want people to know that there is today another school that is 94% Latino because that sounds too much like the Lincoln School. They certainly do not want people noticing the racial/ethnic composition of elite programs like PAVE, Kaleidoscope and the AP/Honors program or the abysmal on-time graduation rates for black (55%) and Latinos (51%).http://www.newrochelletalk.com/content/notes-jan-25-new-rochelle-boe-meeting-tax-cap-resolution-delayed-opening-snow-days-ignoring-
For the entire article:
Thursday, February 24, 2011
Among the young, blogging is in decline because . . . writing is just too hard
Kim Hou, a high school senior in San Francisco, said she quit blogging months ago, but acknowledged that she continued to post fashion photos on Tumblr. “It’s different from blogging because it’s easier to use,” she said. “With blogging you have to write, and this is just images. Some people write some phrases or some quotes, but that’s it.”Here are some numbers.
The Internet and American Life Project at the Pew Research Center found that from 2006 to 2009, blogging among children ages 12 to 17 fell by half; now 14 percent of children those ages who use the Internet have blogs. Among 18-to-33-year-olds, the project said in a report last year, blogging dropped two percentage points in 2010 from two years earlier...I feel like a dinosaur.
While the younger generation is losing interest in blogging, people approaching middle age and older are sticking with it. Among 34-to-45-year-olds who use the Internet, the percentage who blog increased six points, to 16 percent, in 2010 from two years earlier, the Pew survey found. Blogging by 46-to-55-year-olds increased five percentage points, to 11 percent, while blogging among 65-to-73-year-olds rose two percentage points, to 8 percent.
http://www.nytimes.com/2011/02/21/technology/internet/21blog.html?src=me&ref=general
Technology islands
This is how 8th grade students at our local school have been spending class time.

Class description:

The students in Tom Boissonnault’s eighth-grade technology classes at Eastchester Middle School were asked to build functional city islands, including power systems, fresh water systems, housing and transportation systems.http://reviewpress.lohudblogs.com/2011/02/03/creating-city-islands-in-eastchester/
Class description:
Grade 8 Technology
Eighth Grade Technology is a combination of engineering technology, mechanical/
electronics technology and digital photography. Students are required to design and
construct an island project, paying close attention to mechanical systems. Students also
participate in an introductory course in digital photography and a small engine and power
module that involves the restoration of a Vintage scooter.
Wednesday, February 23, 2011
Update on health care costs paid by employees
Updated information to my February 21 post.
PERCENTAGE OF HEALTH INSURANCE PREMIUM COSTS PAID BY EMPLOYEES
Wisconsin Governor Walker:
* Kaiser Family Foundation 2008 Survey
** Kaiser Family Foundation 2010 Survey
Related:
http://www.politifact.com/truth-o-meter/statements/2011/feb/21/george-will/george-will-says-wisconsin-governors-benefits-prop/
Found at Instapundit
PERCENTAGE OF HEALTH INSURANCE PREMIUM COSTS PAID BY EMPLOYEES
Employer category | Percent of premium paid by employee for individual coverage | Percent of premium paid by employee for family coverage |
Local school | 6.5% | 6.5% |
Wisconsin public schools | 6.3% | 6.3% |
New York State | 10% | 25% |
Private sector average 2008 * | 16% | 27% |
Private sector average 2010 ** | 19% | 36% |
Wisconsin Governor Walker:
However, the difficult reality is that healthcare costs and pension costs have risen dramatically and that has created a benefit system that is simply unsustainable. Government benefits have grown while so many others in the private sector have seen their benefits adjusted in order to protect jobs.
* Kaiser Family Foundation 2008 Survey
** Kaiser Family Foundation 2010 Survey
Related:
http://www.politifact.com/truth-o-meter/statements/2011/feb/21/george-will/george-will-says-wisconsin-governors-benefits-prop/
Found at Instapundit
Are scholarships subject to income tax?
Generally speaking, grants and scholarships that exceed the costs of tuition, fees, books and supplies are taxable income. Money received to pay for room and board, as well as travel, is considered taxable.
 http://www.irs.gov/pub/irs-pdf/p970.pdf

Tuesday, February 22, 2011
Why are people angry at teachers?
Whether it's warranted or not, many people are angry with teachers or, perhaps more accurately, with teacher unions. Here's The Other McCain's take on the teachers in Wisconsin.
Here's more.
THE AVERAGE TEACHER PAY IN WISCONSIN IS NEARLY $50,000; THEY GOT A 4.7% RAISE LAST YEAR AND 21% OVER THE LAST 10 YEARS.
http://astuteblogger.blogspot.com/2011/02/teachers-in-wisconsin-make-more-than.html
The unemployed, the under-employed and regular folks trying to pay their bills aren't likely to have a lot of love for people who (a) have jobs, (b) work at taxpayer expense, (c) get paid more money than the average taxpayer, and (d) go on strike because they don't want to pay a dime toward their own generous benefits.Here's one teacher's perspective:
Then I discovered that Wisconsin teachers currently pay nothing--nothing!--toward their own pension plans, and pay only 6% of their salaries toward their health care plans. Yes, I pay more, substantially more, yet, I still don’t begrudge them their relative good fortune. However, when I discovered that Gov. Walker is expecting them to pay 5.8% (instead of 0%) toward their pensions, and 12% (instead of 6%) toward their health insurance, any sympathy I had for them instantly evaporated.Found at Instapundit
Here's more.
THE AVERAGE TEACHER PAY IN WISCONSIN IS NEARLY $50,000; THEY GOT A 4.7% RAISE LAST YEAR AND 21% OVER THE LAST 10 YEARS.
http://astuteblogger.blogspot.com/2011/02/teachers-in-wisconsin-make-more-than.html
New York gets an A- in history standards!
Unfortunately, most other states did not fare as well.

New York gets an A-
[T]he Thomas B. Fordham Institute’s first review of the quality of state U.S. history standards since 2003. Key findings include:
- A majority of states’ standards are mediocre-to-awful. The average grade across all states is barely a D. In twenty-eight jurisdictions — a majority of states — the history standards earn Ds or below. Eighteen earn Fs.
- Just one state — South Carolina — has standards strong enough to earn a straight A.
- Six other states — Alabama, California, Indiana, Massachusetts, New York, and the District of Columbia — earn A-minuses, and three more received grades in the B range. Still, this means just ten states — or about one in five — get honors marks.
The study also reviewed the framework for the National Assessment of Educational Progress’s (NAEP) U.S. history examination and found it deserving of an A-minus. Thus, there are several national models — from the strongest state standards to the NAEP — that lagging states could and should emulate going forward.

New York gets an A-
New York’s U.S. history standards are among the most substantively comprehensive andI would agree that thematic organization sometimes trumps chronological presentation, especially in the elementary grades. The "suggested classroom exercises" for grades K-8 are another area where I would probably wish for something different, since these exercises seem not to include sufficient writing. According to the Fordham report, high school standards only cover American history. I thought world history was included in high school, but apparently not.
sophisticated in the country. Despite occasional departures from chronology and gaps or
shortcomings in content, the overall package could serve as a model for many other states.
New Rochelle schools collecting feedback online
This survey from the New Rochelle School District sounds like a positive move, but the design is being criticized as restricting answer choices and failing to capture a sufficiently accurate scope of views.
Among the comments to the story:
Here are the survey questions:
As the budget season nears, and with the prospect of a 2 percent cap on propertyhttp://www.lohud.com/article/20110208/NEWS02/102080322/New-Rochelle-schools-seek-feedback-via-webtax on the horizon, New Rochelle school officials are asking the public to participate.
The district last week launched a six-question survey (one of the questions has eight parts) on its website, www.nred.org. It asks respondents to rate the importance of such issues as class size; preserving advanced-placement classes and electives like psychology; the use of up-to-date technology in class; and junior varsity and varsity athletics.....
"No schooldistrict in this state can shy away from the fact that there will need to be cuts and reductions," he said. "We're just trying to figure out where everybody stands."
Among the comments to the story:
I work as a research analyst and 6 questions won't really tell you anythingThe Talk of the Sound blog labels the survey a "farce".
Here are the survey questions:
1. Please read each area on the left and select the description from the row above that best defines, for you, how important the area is for the schools and community.I. Up-to-date technology in classrooms and its use in our schools
II. Current class sizes
III. Clubs at the MS and HS, like Math Club or Yearbook
IV. JV and Varsity Athletics
V. Middle School Athletics
VI. Band, Orchestra, Chorus and Art at the Elementary Level
VII. Preserving AP Classes, like Statistics or other advanced/honors classes
VIII. Preserving HS electives, like Psychologya. Essential and critical to the school district’s mission
b. Very important to our mission and worth preserving at almost all costs
c. Good to have, but not essential for our district
d. Not important enough to preserve in a time of fiscal constraint
e. No opinion.2. Do you have any comments about the importance of the categories listed above that you’d like to share?3. Please tell us a little bit about yourself. You are a:Parent/guardian of a current private school student
Community member without a child in school
Parent/guardian of current school age student
Student4. If you are a parent or student in the District, please indicate the grade level(s) you or your child(ren) attend.Elementary School
Middle School
High School5. Over the past 10 years, how would you describe your voting consistency with regard to school elections?Poor – I have voted in only a small number of school elections
Average – I have voted in about half of the school elections
Exceptional – I have voted in every election
Awful – I have not voted in ANY school elections
Very Good – I have voted in most school elections6. When you think about what motivates you to come to the polls for a school election, which answer best fits how you feel?I am most motivated by taxes being raised or lowered.
I am most motivated by programs added, reduced, or eliminated.
I am most motivated by the Board of Education election.
I am most motivated by the desire to exercise the right to vote.
Monday, February 21, 2011
Local school health benefits
If I am reading the contract correctly, our local teachers pay 6.5% of their health insurance premium costs for both individual and family coverage. In addition, if a teacher opts out of participating in the district health plan, she will receive 20% of the premium amount back as a payment.
New York State employees pay 10% of the premium for individual and 25% for family coverage. In the private sector, employees on average pay 16% of the premium for individual coverage and 27% for family coverage. (Source: The Kaiser Family Foundation Employer Health Benefits 2008 Survey, page 68)
PERCENTAGE OF HEALTH INSURANCE PREMIUM COSTS PAID BY EMPLOYEES
2/23/11 UPDATE
ADDED: Wisconsin teachers pay 6%.
New York State employees pay 10% of the premium for individual and 25% for family coverage. In the private sector, employees on average pay 16% of the premium for individual coverage and 27% for family coverage. (Source: The Kaiser Family Foundation Employer Health Benefits 2008 Survey, page 68)
PERCENTAGE OF HEALTH INSURANCE PREMIUM COSTS PAID BY EMPLOYEES
Employer | Percent of premium paid by employee for individual coverage | Percent of premium paid by employee for family coverage |
Local school | 6.5% | 6.5% |
New York State | 10% | 25% |
Private sector average | 16% | 27% |
2/23/11 UPDATE
ADDED: Wisconsin teachers pay 6%.
Walker is also doubling the amount state employees pay for their health care benefits, from 6 percent of their premium currently, to 12 percent of their premium. (From the New York Times)
Related: http://educationquicktakes.blogspot.com/2011/02/cut-new-york-public-schools-health.html1. Employer payment under the State Health Insurance Plan will be in the amount of (100%) of an individual policy and (100%) of a family policy. The District reserves the right to change health insurance to an alternate carrier, provided that there be no diminution in benefits and that service be comparable. Effective July 1, 2006 bargaining unit members will pay a percentage of the cost of health insurance according to the following schedule: July1, 2006—5%, July 1, 2007—6%, July 1, 2008—6%, July 1, 2009—6.25% and July 1, 2010—6.5%
2. Payment to GHI, HIP and Health Maintenance Organization Plan participants will be in a monetary payment equal to the amounts provided by the above amounts.
3. Effective July 1, 1988 the Board will pay health insurance premiums in the amount of 70% for individual coverage and 50% for family coverage for teachers retiring after July 1, 1987. Effective July 1, 1990 the Board’s contribution will be limited to the lesser of (a) the proportionate dollar increase in premiums for 1990-91 over 1989-90, or (b) ten percent (10%) above the proportionate dollar increase in premiums for 1990-91 over 2989-90. The Board’s contribution will revert to the percentage paid prior to the institution of this clause (50% for individual coverage and 35% for family coverage) upon the teacher’s attaining eligibility for coverage under Medicare.
4. The Board agrees to pay any active teacher eligible for full health insurance benefits, who is already covered by another health insurance plan 20% of the Board’s premium, family or individual, as eligible for each full year the teacher declines coverage under the District’s health insurance program. Payment will be made at the conclusion of the one year period.
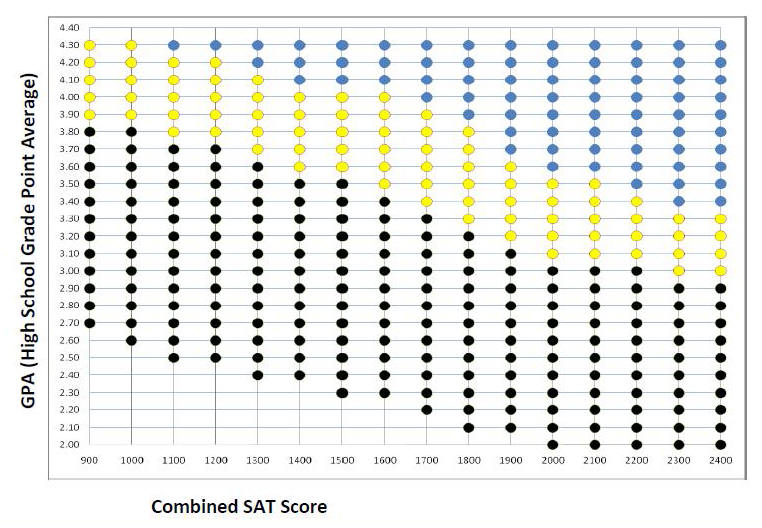
Penn State bubble chart
I wish all colleges published charts like this. It would make things so much clearer during the muddy, anxiety-provoking college application process. Perhaps others disagree.
Penn State University Park is ranked 47 on the list of national universities by USNWR. Many state universities have similar "by the numbers" admissions standards, but most do not broadcast them in such a straightforward fashion as Penn State does.

Here is their explanation:
Penn State University Park is ranked 47 on the list of national universities by USNWR. Many state universities have similar "by the numbers" admissions standards, but most do not broadcast them in such a straightforward fashion as Penn State does.
Here is their explanation:
To use the graph, plot the student’s cumulative high school grade point average and best combined SAT score from a single test date. The scale used is based on a 4.0 grading system that takes into consideration weighted grades. Based on the color of the point where the GPA and SAT score intersect, you can use the key below to estimate the student’s likelihood for admission to Penn State.
- BLUE - The student is likely to be offered admission to his/her first choice of Penn State campus, including University Park.
- YELLOW - The student is likely to be offered admission to a Penn State campus other than University Park. Additional review would be needed to determine eligibility for admission to University Park.
- BLACK - The student is likely to be offered admission to a Penn State campus other than University Park. Additional review would be needed for specific campuses and/or programs.
http://admissions.psu.edu/info/counselors/bubble_chart.pdf
Related: A CollegeConfidential discussion on this chart
Related: A CollegeConfidential discussion on this chart
Subscribe to:
Comments (Atom)